Cumulative Impacts
Cumulative impacts are incremental and combined effects from pollution sources, that while individually might be minor, collectively have much greater health and environmental impacts. Contaminants can find their way into our homes and bodies through the air, water, soil, and even our food!
According to a 2018 Duke University study, the health risks associated with exposure to industrial swine operations over time include: asthma, kidney disease, sepsis- bacterial infections of the blood, low birth weight, and infant mortality. Moreover, a Johns Hopkins DNA sequencing study released in 2021 suggests that antibiotic resistant bacterial strains are spreading from pigs to community members - an emerging health crisis! Such health risks are compounded for communities that are also home to “deemed permitted” poultry facilities which occur in locations and concentrations unknown to DEQ.
Similar to industrial hog farms, poultry operations' health risks include blue-baby syndrome, colorectal cancer, thyroid disease, neural tube defects, spontaneous abortions and prematurity, rashes, stomach illnesses, respiratory problems like asthma and pneumonia, and neurological issues. These negative health impacts are compounded when other industries are nearby like wood pellet plants, coal ash reprocessing plants, oil and gas pipelines, and more.
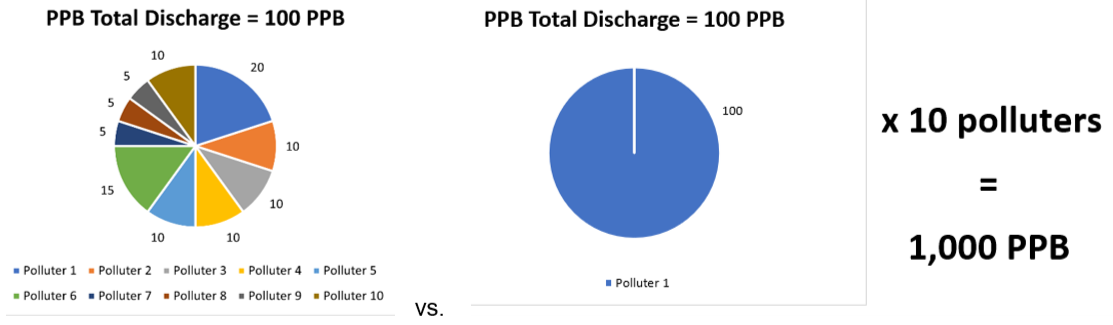
Currently, water and air permits for polluters in North Carolina are considered based on the individual permit, not how its emissions or discharges from the proposed activities may contribute to the load cumulatively with other polluting sources. For example, if the maximum contaminant level for Pollutant X is 100 parts per billion (ppb), that means that the highest allowable discharge that is considered safe for the community is 100ppb. However, permits are being granted where each facility will be allowed to pollute 100ppb a piece. As other polluters also apply for permits, they are also allowed 100ppb.
If 10 polluters receive permits to emit or discharge 100ppb each, they end up dumping a collective 1,000ppb on the community even though the maximum contaminant level of what is considered “safe” is only 100ppb. Rather than allocating various industries a slice of the pollutant pie, they’re all just being allotted whole pies each! And all of this is at the expense of the neighboring communities and environment.
Adding insult to injury, the communities facing these cumulative impacts in highest concentrations are also disproportionately low-income, BIPOC (black, indigenous, or people of color), and/or have pre-existing health vulnerabilities. A newly released data tool may prove helpful in identifying and understanding the ramifications of these cumulative and disproportionate impacts on health.
Introducing the Environmental Justice Index
The Environmental Justice Index (EJI) was released on August 10, 2022, as part of the Agency for Toxic Substances and Diseases Registry and the Center for Disease Control and Prevention (CDC). The index aggregates data from several sources to rank the cumulative impacts of environmental injustice on health for every census tract, measuring the environmental burden on health/equity and identifying those areas most at risk for health impacts.
EJI defines census tract as “the smallest subdivisions of land for which demographic and health data are consistently available. Each census tract is part of a particular county and is home to an average of 4,000 people.” Data comes from the U.S. Census Bureau, the U.S. Environmental Protection Agency, the U.S. Mine Safety and Health Administration, and the U.S. Centers for Disease Control and Prevention. Of particular interest about the EJI, is that it provides a single score for each community down to the census tract to help identify which communities are most impacted and at risk from environmental burdens.
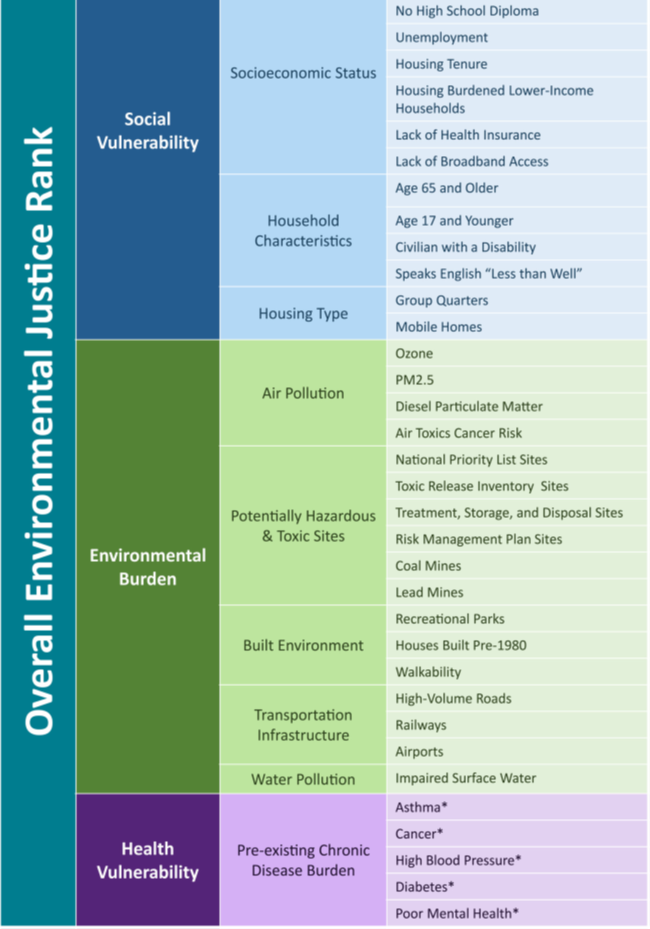
The rankings are based on breakouts of (1) Social Vulnerability such as socioeconomic status, household characteristics, and housing type; (2) Environmental Burden such as air pollution, potentially hazardous & toxic sites, built environment, transportation infrastructure, and water pollution; and (3) Health Vulnerability such as pre-existing chronic disease burden. It’s further broken down in the image below. You can click the image to access the original pdf from CDC with more detail and in accessible text format.
So, Now What?
While many NC communities already know these impacts, living them everyday, our state lawmakers and regulatory agencies regularly claim that data is insufficient to legislate or fund certain initiatives, such as requiring consideration of EJ, cumulative, or disparate impacts in environmental permitting.
Of course, a tool is only as good as the data it uses, so we will continue pushing for continued and expanding environmental monitoring and analyses by industry, regulators, academics, and the nonprofit sector. Clean Water for NC will continue and grow its own environmental monitoring and analyses efforts as well as fighting for actual tracking of all polluting facilities, given that most Factory Farm sites are not accounted for by the NC Department of Environmental Quality.
This EJI tool, combined with environmental monitoring data and several other data tools, provides the very justification our legislators and regulators claim they need and it is high time our state’s decision-makers take heed! We will continue diving deeper into this tool and make recommendations where applicable for continued improvement.
If you have questions about the air and water impacts on your community’s health, want to share your experience, or just plain want to connect with others who may be experiencing similar issues, start connecting on Storybank or reach out to us at info@cwfnc.org.
Source: Centers for Disease Control and Prevention and Agency for Toxic Substances Disease Registry. 2022 Environmental Justice Index. Accessed August 12, 2022. https://www.atsdr.cdc.gov/placeandhealth/eji/index.html
For more information about other helpful data and mapping tools, visit our Community Tools page. We offer this resource page for publicly available search tools and mapping applications like EPA’s EJScreen Map, DEQ’s Community Mapping System, and more. We also provide how-to-videos, guides, fact sheets, and more. Our team is currently reviewing the EJI Tool and we may add it to our resource page soon. Stay tuned!